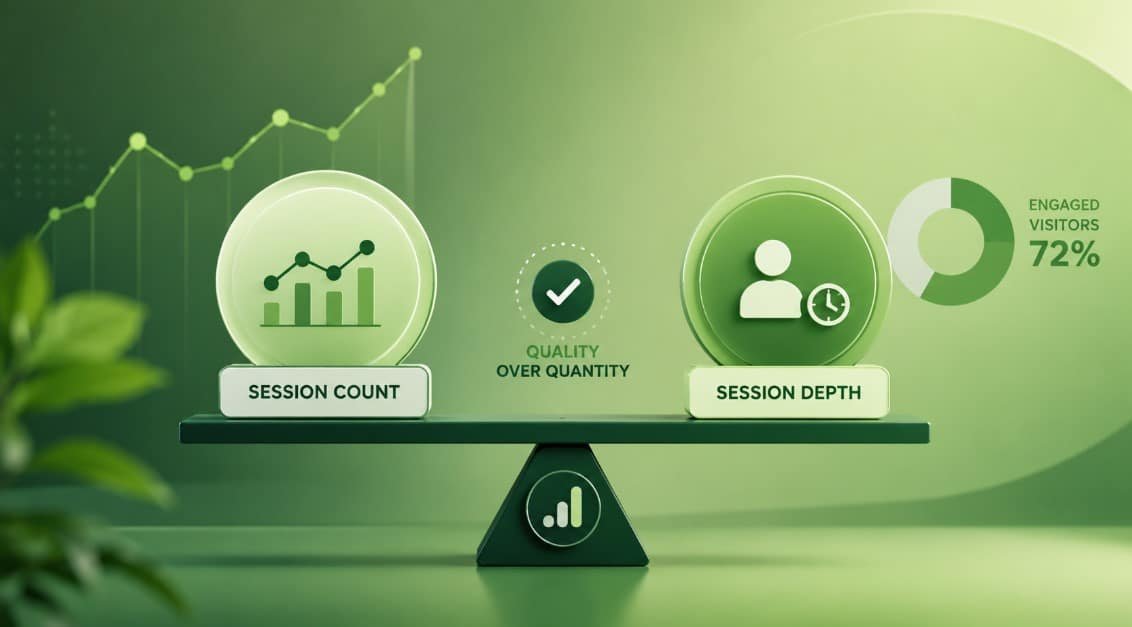
Session Depth vs. Session Count : A visit count only tells you that someone showed up. It says nothing about what happened after.
Session depth is different. It tells you whether that visit found enough value to stick around and keep clicking. For any busy site owner or marketer, that gap is the whole story. It’s the difference between reporting activity and actually understanding quality.
Google Analytics 4 makes this easier to measure than most people expect. GA4 already defines an “engaged session” as one that runs at least 10 seconds, triggers a key event, or racks up two or more page or screen views. By default, a session also closes out after 30 minutes of inactivity.
Those built-in rules are a decent starting point. But they still won’t answer the question that actually matters: which of your traffic sources bring people who explore your site properly, and which ones just bounce through?
You get that answer by lining up session-scoped acquisition data against views, devices, key events, and revenue. It sounds like a lot, but it isn’t. Start with a simple average. Build out 3-view and 5-view depth groups. Then connect those groups to device type and conversion value. One idea should guide every step: a metric only earns its keep if it tells you something real about what visitors needed and whether your site delivered.
Average Pages Viewed by Traffic Source
Think of an average the way you’d think of the temperature reading on a weather app. It’s a fine starting point for planning your day, but it won’t tell you whether you need an umbrella at 3pm. Treat your first comparison the same way: simple, consistent, and a jumping-off point rather than a final verdict.
Start in Reports, then Acquisition, then Traffic acquisition. This is where GA4 shows you where sessions from new and returning visitors came from, which makes it the natural home base for any visit-level comparison.
From here, you’ve got two dimensions worth knowing. Session source/medium gives you granular detail, things like Google/organic or newsletter/email. Session default channel group gives you a cleaner, higher-level view across Organic Search, Paid Search, Email, Referral, and similar buckets.
Related : Skyrocket Your ROI with these 24 Powerful Email Marketing Services.
The word “session” matters more than it looks. First user source/medium tells you how someone was originally acquired. Session source/medium tells you where the current visit came from. Someone might have first discovered you through organic search, then come back later through an email link. Those are two different questions with two different answers. For measuring depth, you want the session-scoped version every time.
Next, bring in Views per session, either through report customisation or a Free-form Exploration built with the same session dimensions. GA4 calculates this as total page and screen views divided by total sessions, and it counts repeat views of the same page toward that total.
That repeat-view detail is worth remembering. Someone who refreshes a single page five times will look “deep” in the data even though they never actually explored anything new. To keep yourself honest, pair Views per session with Engagement rate, Average engagement time per session, and Events per session before drawing any conclusions.
A few housekeeping rules make the comparison trustworthy. Use one date range, one reporting identity, and one attribution setup across every source you’re comparing. Strip out internal staff, developers, monitoring tools, and any labelled test traffic. A campaign launch, a broken tag, or a weird referral spike can shift your average without a single real change in audience behaviour.
Sample size matters too. A source with two sessions and six views per session isn’t automatically outperforming one with 20,000 sessions and three views per session. Set a minimum session threshold that makes sense for your traffic, and always show Sessions right next to Views per session so tiny samples don’t get mistaken for meaningful trends.
One more trap to avoid: never average your averages in a spreadsheet. If Source A logs 100 sessions at four views per session, and Source B logs ten sessions at eight, the blended number isn’t six. Pull the raw Views and Sessions columns, sum each one separately, then divide total views by total sessions. That weighted number actually reflects your real traffic mix, instead of pretending every source carries equal weight.
The takeaway here is simple. Use the average to flag channels worth a closer look, not to crown a winner. A high number could mean genuine interest, confusing navigation, or visitors stuck in a content loop. The only way to know which is to look at what’s behind the number.
Deep-Session Rates Across Acquisition Channels
An average can quietly hide a split audience, the same way an “average shoe size” tells a store almost nothing useful about what to stock. One unusually active visitor can drag a channel’s average upward even if every other session from that source ends after a single page.
That’s exactly what deep-session rates are built to catch. They show how often a source clears a threshold that actually means something, rather than papering over a mixed crowd with a single number.
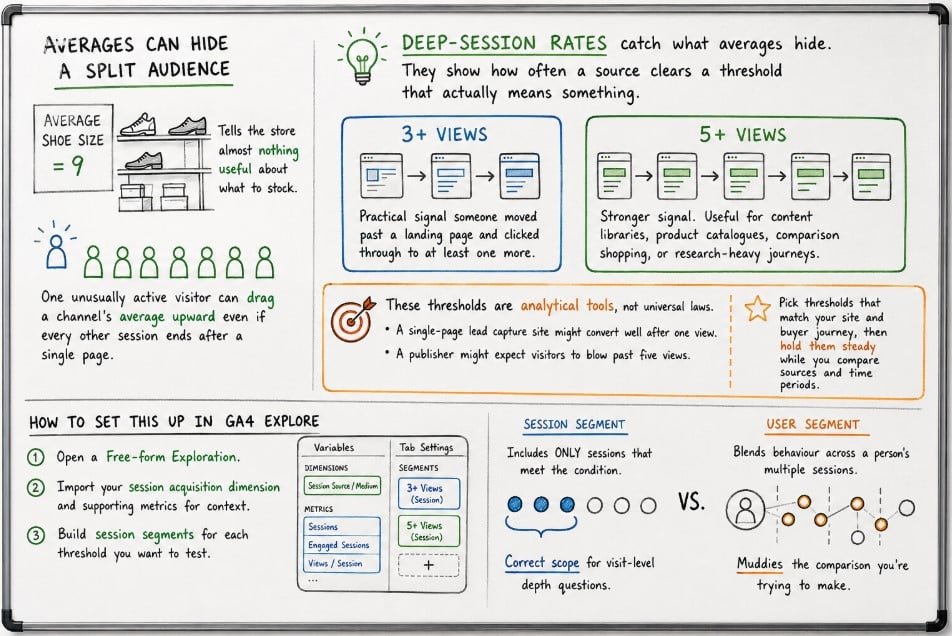
Start with two cumulative thresholds. Three-plus views is a practical signal that someone moved past a landing page and clicked through to at least one more. Five-plus views is a stronger signal, useful for content libraries, product catalogues, comparison shopping, or research-heavy service journeys.
These thresholds are analytical tools, not universal laws. A single-page lead capture site might convert perfectly well after one view. A publisher, on the other hand, might expect visitors to blow past five views without blinking. Pick thresholds that actually match your site’s structure and buyer journey, then hold them steady while you compare sources and time periods.
Inside Explore, open a Free-form Exploration and import your session acquisition dimension along with whatever supporting metrics give you context. Build session segments for each threshold you want to test. A session segment pulls activity from sessions that meet its conditions, which is exactly the scope you want for a visit-level depth question. A user segment, by contrast, blends behaviour across a person’s multiple sessions, which muddies the comparison you’re trying to make.
Worth flagging: GA4’s interface and field compatibility shift over time, so don’t assume every threshold you want will be a one-click segment condition in your property. Google itself notes that reports and Explorations don’t support identical fields, Exploration filters are case-sensitive, retention settings cap how far back you can look, and recent data may still be processing. If Views per session won’t behave cleanly inside a session segment, export session-level data to BigQuery (or another properly governed dataset) and count page-view events by ga_session_id instead.
A practical table setup uses Session default channel group or Session source/medium as your rows. Apply the All sessions, 3+ views, and 5+ views segments side by side, then bring in Sessions, Engagement rate, Session key event rate, and Total revenue as your values.
Here’s a scenario worth watching for: your email channel shows a lower average depth than organic search, but a bigger share of 5+ view sessions. That pattern often shows up when a large chunk of email subscribers land on one featured page while a smaller, more motivated group digs through the entire offer. The average and the threshold rate are describing two different slices of the same distribution.
When you spot a gap like that, dig into the landing pages, campaign messaging, and the promise each audience was given. If a paid ad promotes a “pricing calculator” but funnels people to a generic homepage, shallow sessions are probably telling you there’s a relevance gap, not a quality problem with the traffic itself. Fixing the mismatch between message and landing page tends to be more effective, and more honest, than chasing extra clicks for their own sake.
Session Depth by Source and Device
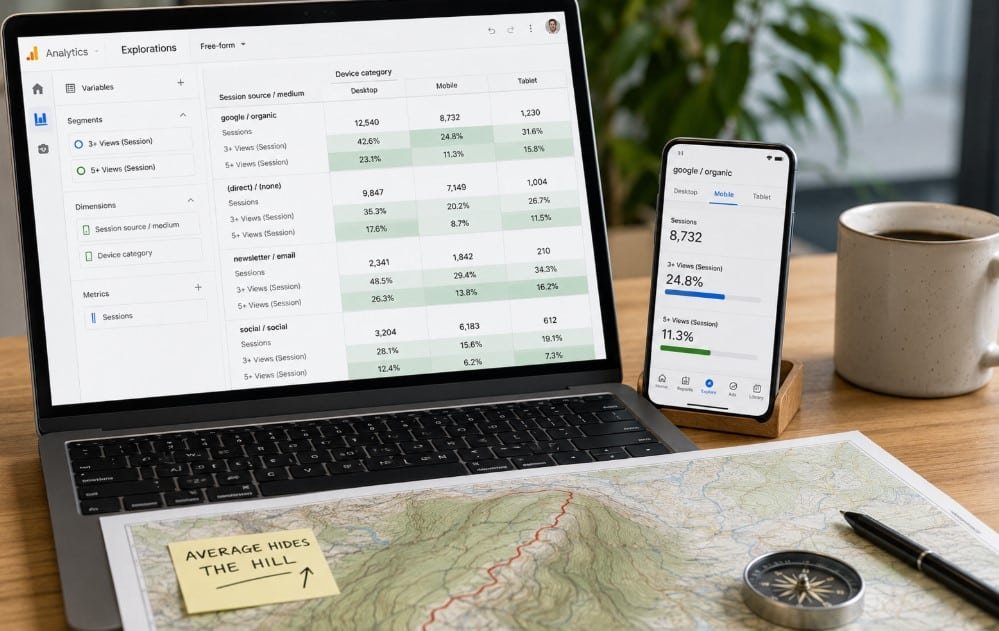
A channel-level average can act like a neatly folded map that hides the hill you’re actually going to have to climb. Device category is usually where that hill shows up. The same traffic source can deliver solid desktop exploration and weak mobile depth, simply because the experience, context, and intent shift depending on the screen.
To check this, open a Free-form Exploration with Session source/medium or Session default channel group as rows and Device category as columns. GA4 defines Device category as desktop, mobile, or tablet, based on the device the activity actually came from. Layer in your 3+ and 5+ session segments, and keep Sessions visible so every rate stays anchored to a real sample size.
A quick diagnostic view can help you read the pattern:
| Observed pattern | Question to investigate | Practical action |
| Strong desktop depth, weak mobile depth | Is the page slow, cramped, or awkward to navigate on a small screen? | Test Core Web Vitals, menus, forms, and tap targets on real devices. |
| Strong mobile social depth, weak desktop depth | Does the campaign creative assume an in-app or mobile-first context? | Keep the message and visuals consistent on the mobile landing page. |
| High depth but low key-event rate on one device | Are visitors exploring because the path to convert isn’t clear? | Review form errors, checkout friction, and call-to-action visibility. |
| Low depth with high conversion rate | Can visitors finish their intended task quickly? | Protect the short path instead of forcing extra page views. |
That last row is the one people tend to skip past. Depth isn’t automatically a win. A returning customer who arrives from an email, opens a renewal page, and completes payment in a single view might be worth far more than a visitor who reads eight articles and never takes the action you actually wanted.
Where it’s compatible, bring in landing pages as a supporting dimension, or run separate explorations for your most important entry pages. If mobile depth is weak across the board, the problem probably lives in the experience itself. If it’s only weak for one campaign, look first at the audience promise, the targeting, or how relevant the landing page actually is.
Give device comparisons enough time to smooth out day-to-day noise, but don’t push past your Exploration’s data-retention window while you do. And keep consent mode, cookie restrictions, and cross-device identity limits in mind throughout. GA4 can’t always recognise the same person moving between a work laptop, a personal phone, and a tablet, so treat device splits as session-level behaviour, not a perfect map of individual people.
Above all, optimise for the visitor’s actual task. Don’t bolt on unnecessary pagination, slideshows, or forced clicks just to inflate Views per session. Tactics like that fake the appearance of depth while making the site genuinely worse to use. Real quality comes from useful next steps, clear internal linking, and a journey that actually helps people get somewhere.
Conversion Value of Deep Sessions by Source
Session depth without value is a bit like a packed restaurant where nobody actually orders food. The last piece of the puzzle is figuring out whether deeper visits line up with outcomes that matter, and whether that relationship shifts depending on the source.
Bring Session key event rate into your channel-and-depth comparison. GA4 defines it as the percentage of sessions where a key event happened. Be selective about what counts as a key event here, things like a completed enquiry, a trial signup, a qualified phone click, a checkout, or a purchase. Marking every minor interaction as a key event just inflates the report and undermines the decisions it’s supposed to support.
If you’re running ecommerce or a monetised app, add Total revenue too. GA4 pulls this from purchase, in-app purchase, subscription, and advertising revenue, minus refunds. It’s worth saying plainly: revenue doesn’t show up correctly just because GA4 is installed. Your implementation has to actually send the right events, values, and currency data, and you should double-check the numbers against your commerce or billing platform.
Run these comparisons across all sessions, 3+ views, and 5+ views, for each source. A few calculations worth having on hand: value per session (total revenue or assigned lead value divided by sessions), value per deep session (value generated within a depth segment divided by sessions in that segment), and deep-session key event rate (deep sessions with a key event divided by all deep sessions).
Read the relationship with a bit of caution. A 5+ view session might convert because someone genuinely researched their options thoroughly. But it might also become “deep” after the purchase happens, if the thank-you flow itself spans several pages. This is a correlation, not proof that more page views cause more conversions. Check the page paths, the event order, and the landing pages before you go changing your funnel based on this alone.
Before you commit real budget to any of this, it’s worth running your own quality-assurance checks first. The public VisitorBoost website-traffic-generator repository is an open-source Python tool built for exactly this kind of testing, it simulates browser sessions so you can verify your setup before trusting the real numbers. Its configuration covers page-per-session ranges, dwell times, device distributions, referrer distributions, and interaction options, all useful for confirming that your analytics events and depth rules are firing the way you expect.
The repository is also built with some sensible guardrails baked in: only test sites you own or have permission to use, start with low concurrency, skip ad clicks, and label or filter your test traffic so it never leaks into production reporting. Its synthetic sessions are genuinely useful for analytics verification, controlled load testing, and sandbox experiments. What they are not, and shouldn’t be treated as, is evidence of real audience interest, conversion intent, or channel quality.
If you’d rather see the service in action without setting up the open-source tool yourself, you can try a free traffic demo for your website. Keep any test like this transparent: use a dedicated campaign label, isolate the date range and source, and exclude those sessions from your normal performance benchmarks. The landing-page demo and the GitHub simulator are two separate offerings, so judge each one on its own documentation and its own results.
Once your tracking is verified, go back to your real acquisition data. Prioritise the sources that combine decent volume, healthy deep-session rates, and genuine business value. Then go fix the weakest link in the chain, whether that’s campaign targeting, the landing-page promise, the mobile experience, internal linking, or the conversion path itself.
That’s really the whole point of session-depth analysis. Nobody’s trying to manufacture a bigger number for its own sake. The goal is a clearer picture of how people actually move through your site, what keeps them going, and which sources genuinely deserve more of your attention.
So start small: pick one stable date range and your five biggest channels. Build the 3+ and 5+ depth groups. Split them by device. Connect the results to key events and revenue. Do that, and you’ll walk away with a far more useful picture than any dashboard full of raw visits could ever give you.